Category: Politics
-
Elections really do have consequences
Pregnant women in Franklin County and neighboring areas of northeast Georgia can no longer deliver babies at St. Mary’s Sacred Heart Hospital just outside Lavonia. But Georgians and, indeed, all Americans now have the privilege of being able to buy gun silencers without having to pony up a $200 tax. How, you might wonder, are…
-
Carter’s funeral and Trump’s inaugural: Bookends to a troubled half-century
After nearly two years in hospice care at his home in Plains, Ga., Jimmy Carter passed away Sunday afternoon at the age of 100. His family had said a few months ago that the nation’s 39th president was set on hanging on until he could cast his vote for Kamala Harris over Donald Trump. He…
-
Helene depressed Georgia’s early vote by about 100,000 votes; impacted both parties but probably hit GOP hardest
An analysis of the impact of Hurricane Helene on early voting in Georgia.
-

Sorting through Georgia’s early voting numbers with political algebra and fuzzy math
A second look at Georgia’s early voting data.
-

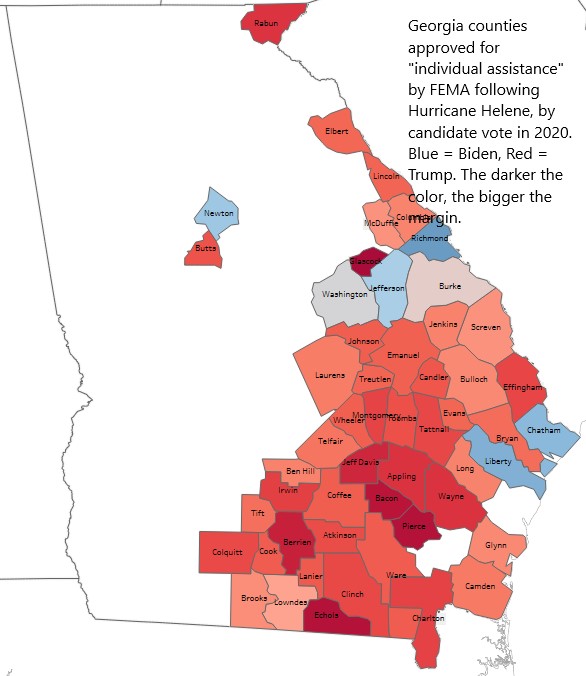
Is Mother Nature voting in this year’s presidential election?
Could the weather gods be messing with our politics? Maybe even engaging in election interference? Probably not, but it’s hard to study a map of the areas hardest hit by Hurricane Helene and not conclude that somebody is highly annoyed with Republicans. Even Republican Congresswoman Marjorie Taylor Greene, who represents northwest Georgia, noticed the political…
-
Are guns and abortion coming home to haunt Gov. Kemp?
(This is my latest column written for the Georgia Trust for Local News. Starting September 19, 20204, it is being published in more than 20 daily and weekly papers in Middle and South Georgia. — CH) On Monday, one of Georgia’s two U.S. senators, Democrat Jon Ossoff, conducted a hearing in Decatur on the impact…
-

Kicking off the Harris-Walz campaign in South Georgia
Sometimes a picture is worth a thousand words, and a good editorial cartoon is worth a couple of zillion. Commercial artist extraordinaire Trevor Irvin took a couple of suggestions I made in my last couple of TIGC posts and turned them into an editorial cartoon that would have made the late Jack Davis proud. Suggestion…
-
Harris and Walz take a cue from TIGC, head to South Georgia
Well, dang. Who knew Kamala Harris and Tim Walz read “Trouble in God’s Country”? Actually, they almost certainly don’t. But it’s one heck of a coincidence that they announced a South Georgia bus tour less than a week after TIGC suggested exactly that. Well, not exactly that. I recommended putting Coach Walz (and members of…
-
Can Coach Walz get the Democrats back in the game in rural Georgia?
(Note: About three months ago, I started writing a weekly “Trouble in God’s Country” column that now runs in about 30 daily and weekly papers, mostly in South Georgia. As a result of that work, however, I’ve been a little distracted from my usual TIGC research, but I’m trying to get back to that now.…